Showcase
Applications
NL4DV-LLM | v3
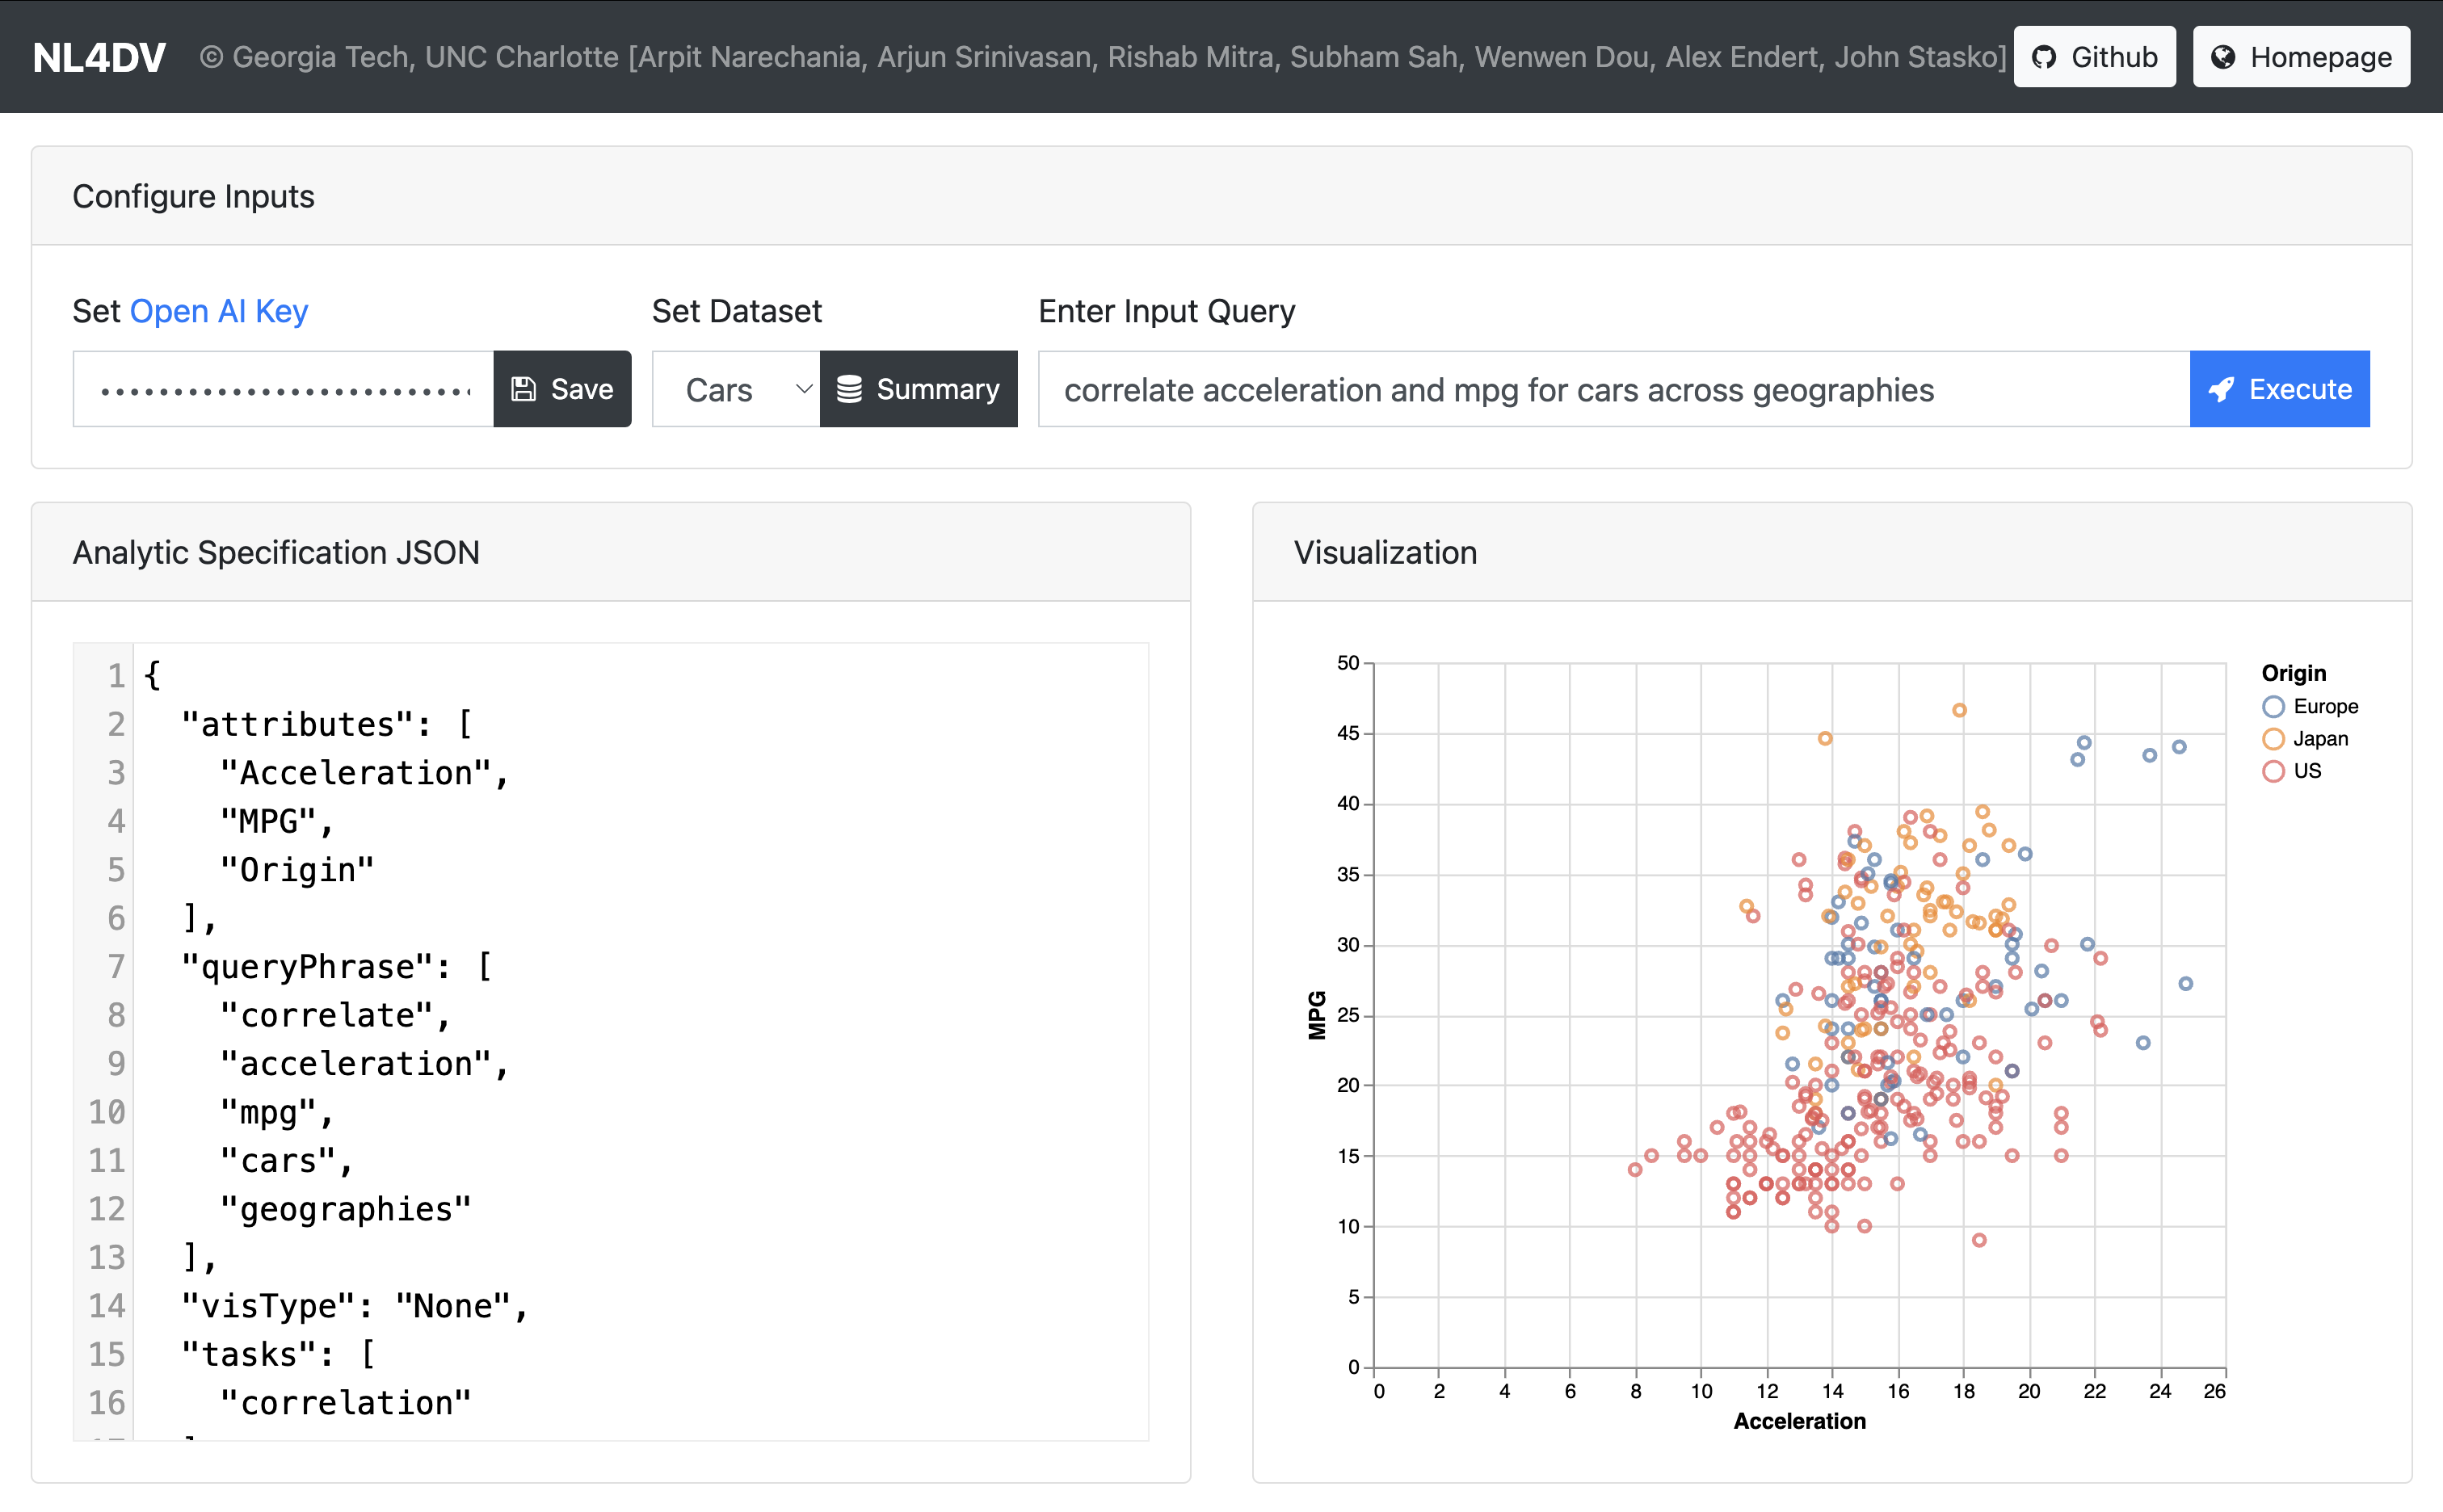
A natural language interface for data visualization, powered by large language models (LLMs). Set your Open AI Key, choose one of existing datasets, and play around with our comprehensive prompt for such tasks!
Vega-Lite Learner | v2
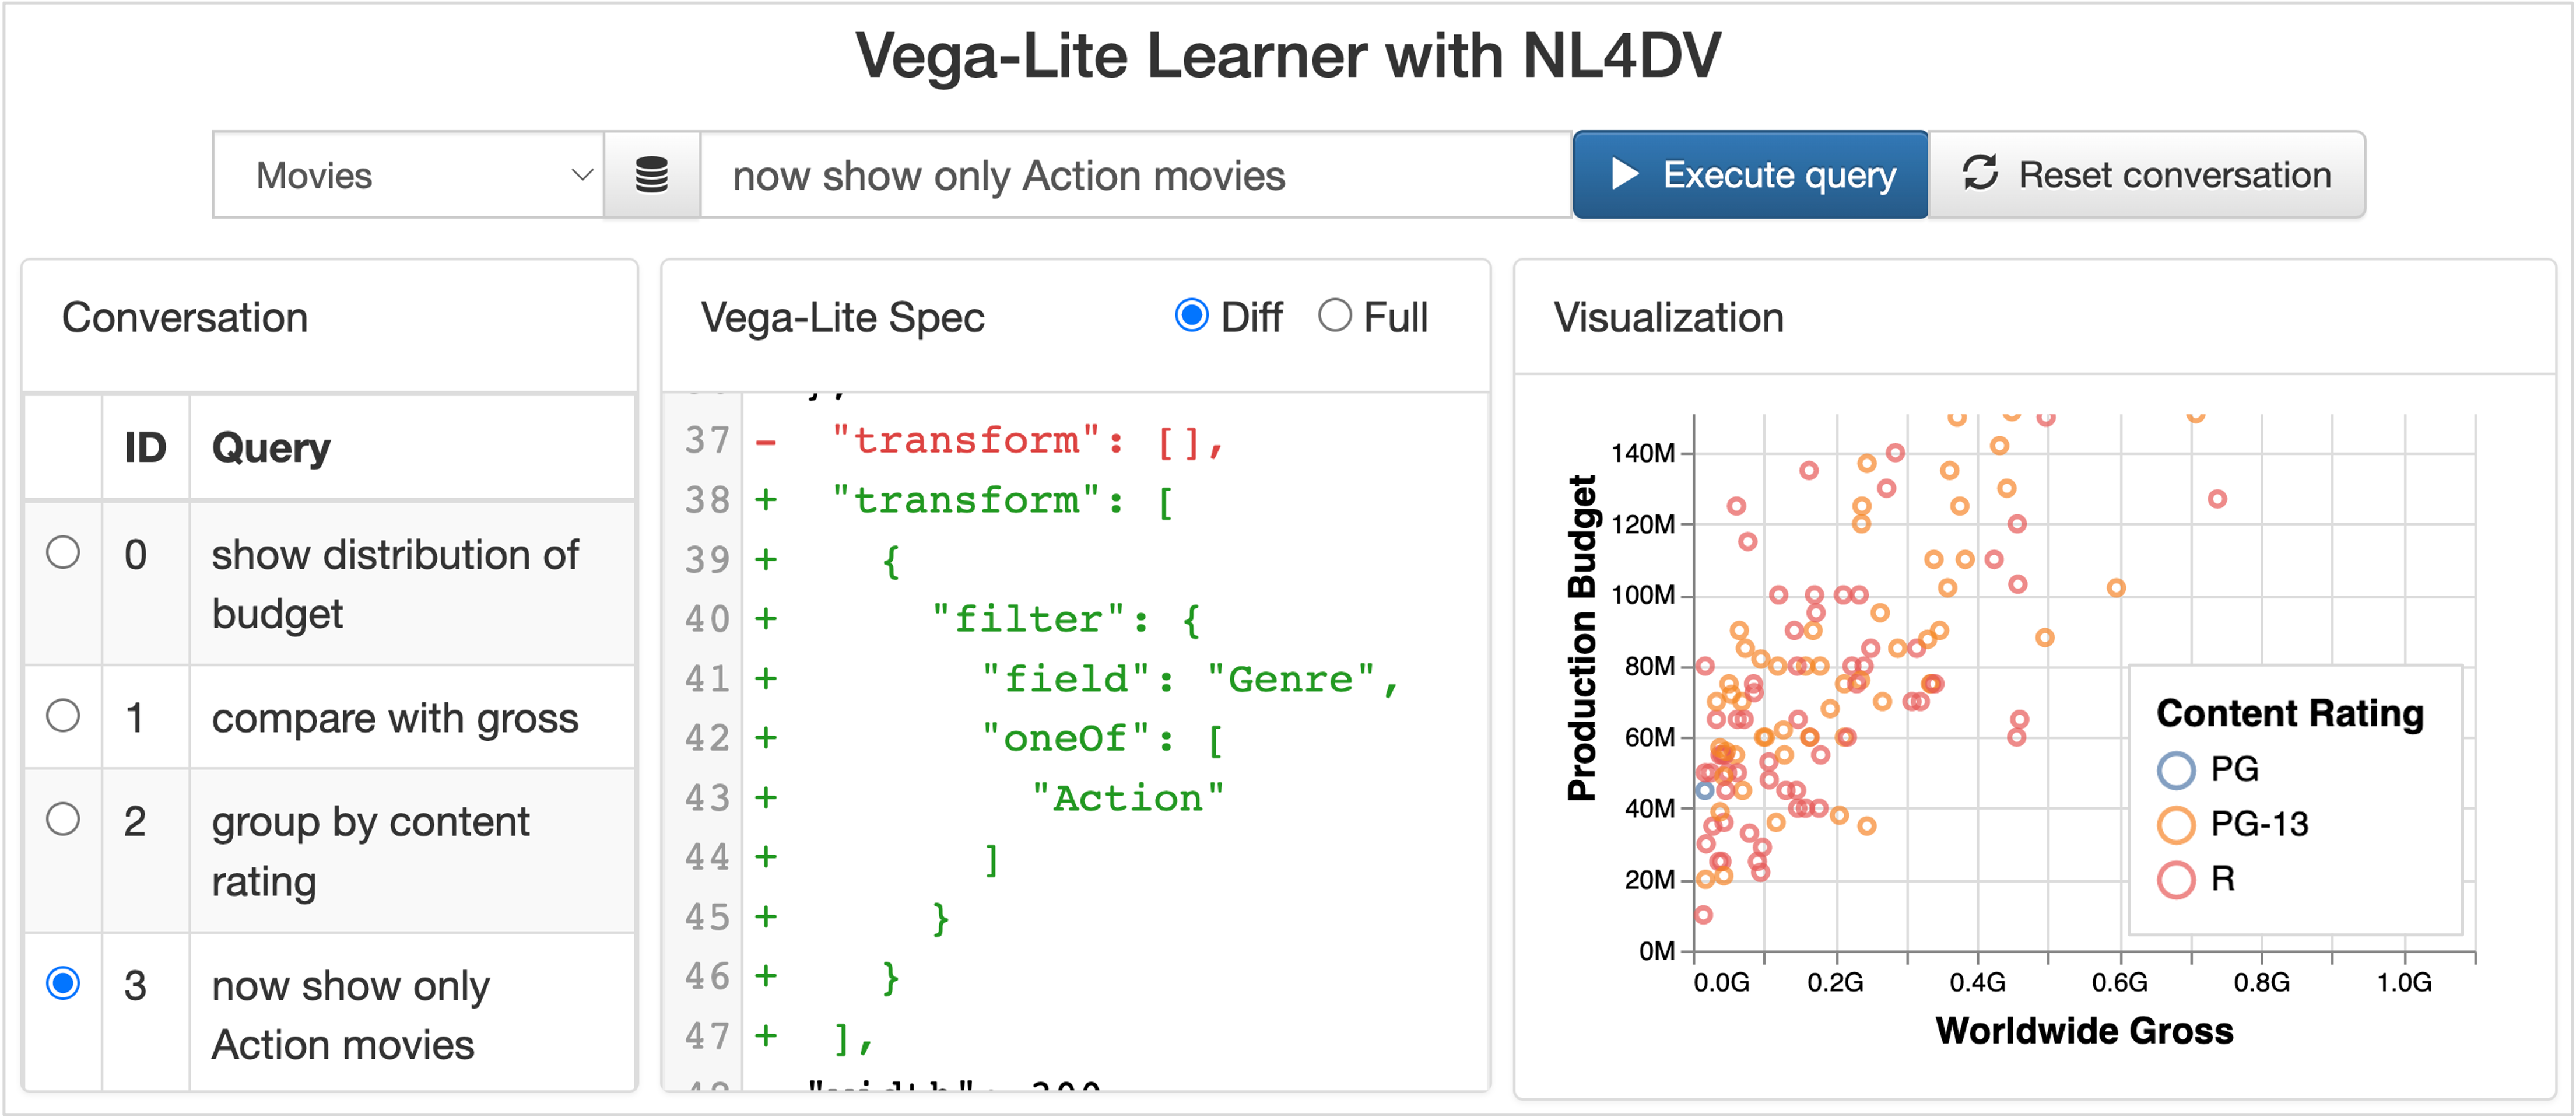
A natural language interface, now powered with conversational interaction capabilities, that helps learning specifications for specific Vega-Lite features, e.g., how filters are specified using the "transform" property. Users can sequentially input queries through the text input box at the top of the page to specify visualizations. These queries get appended to and form a conversation. Users can choose to see the difference (added, removed, or modified entities) between the visualization specification of the chosen query and its predecessor through highlights and annotations. Users can also update a visualization specification at any step of the conversation (albeit this edit will be local and temporary as the updates cannot be propagated along the conversation).
Mind Map | v2
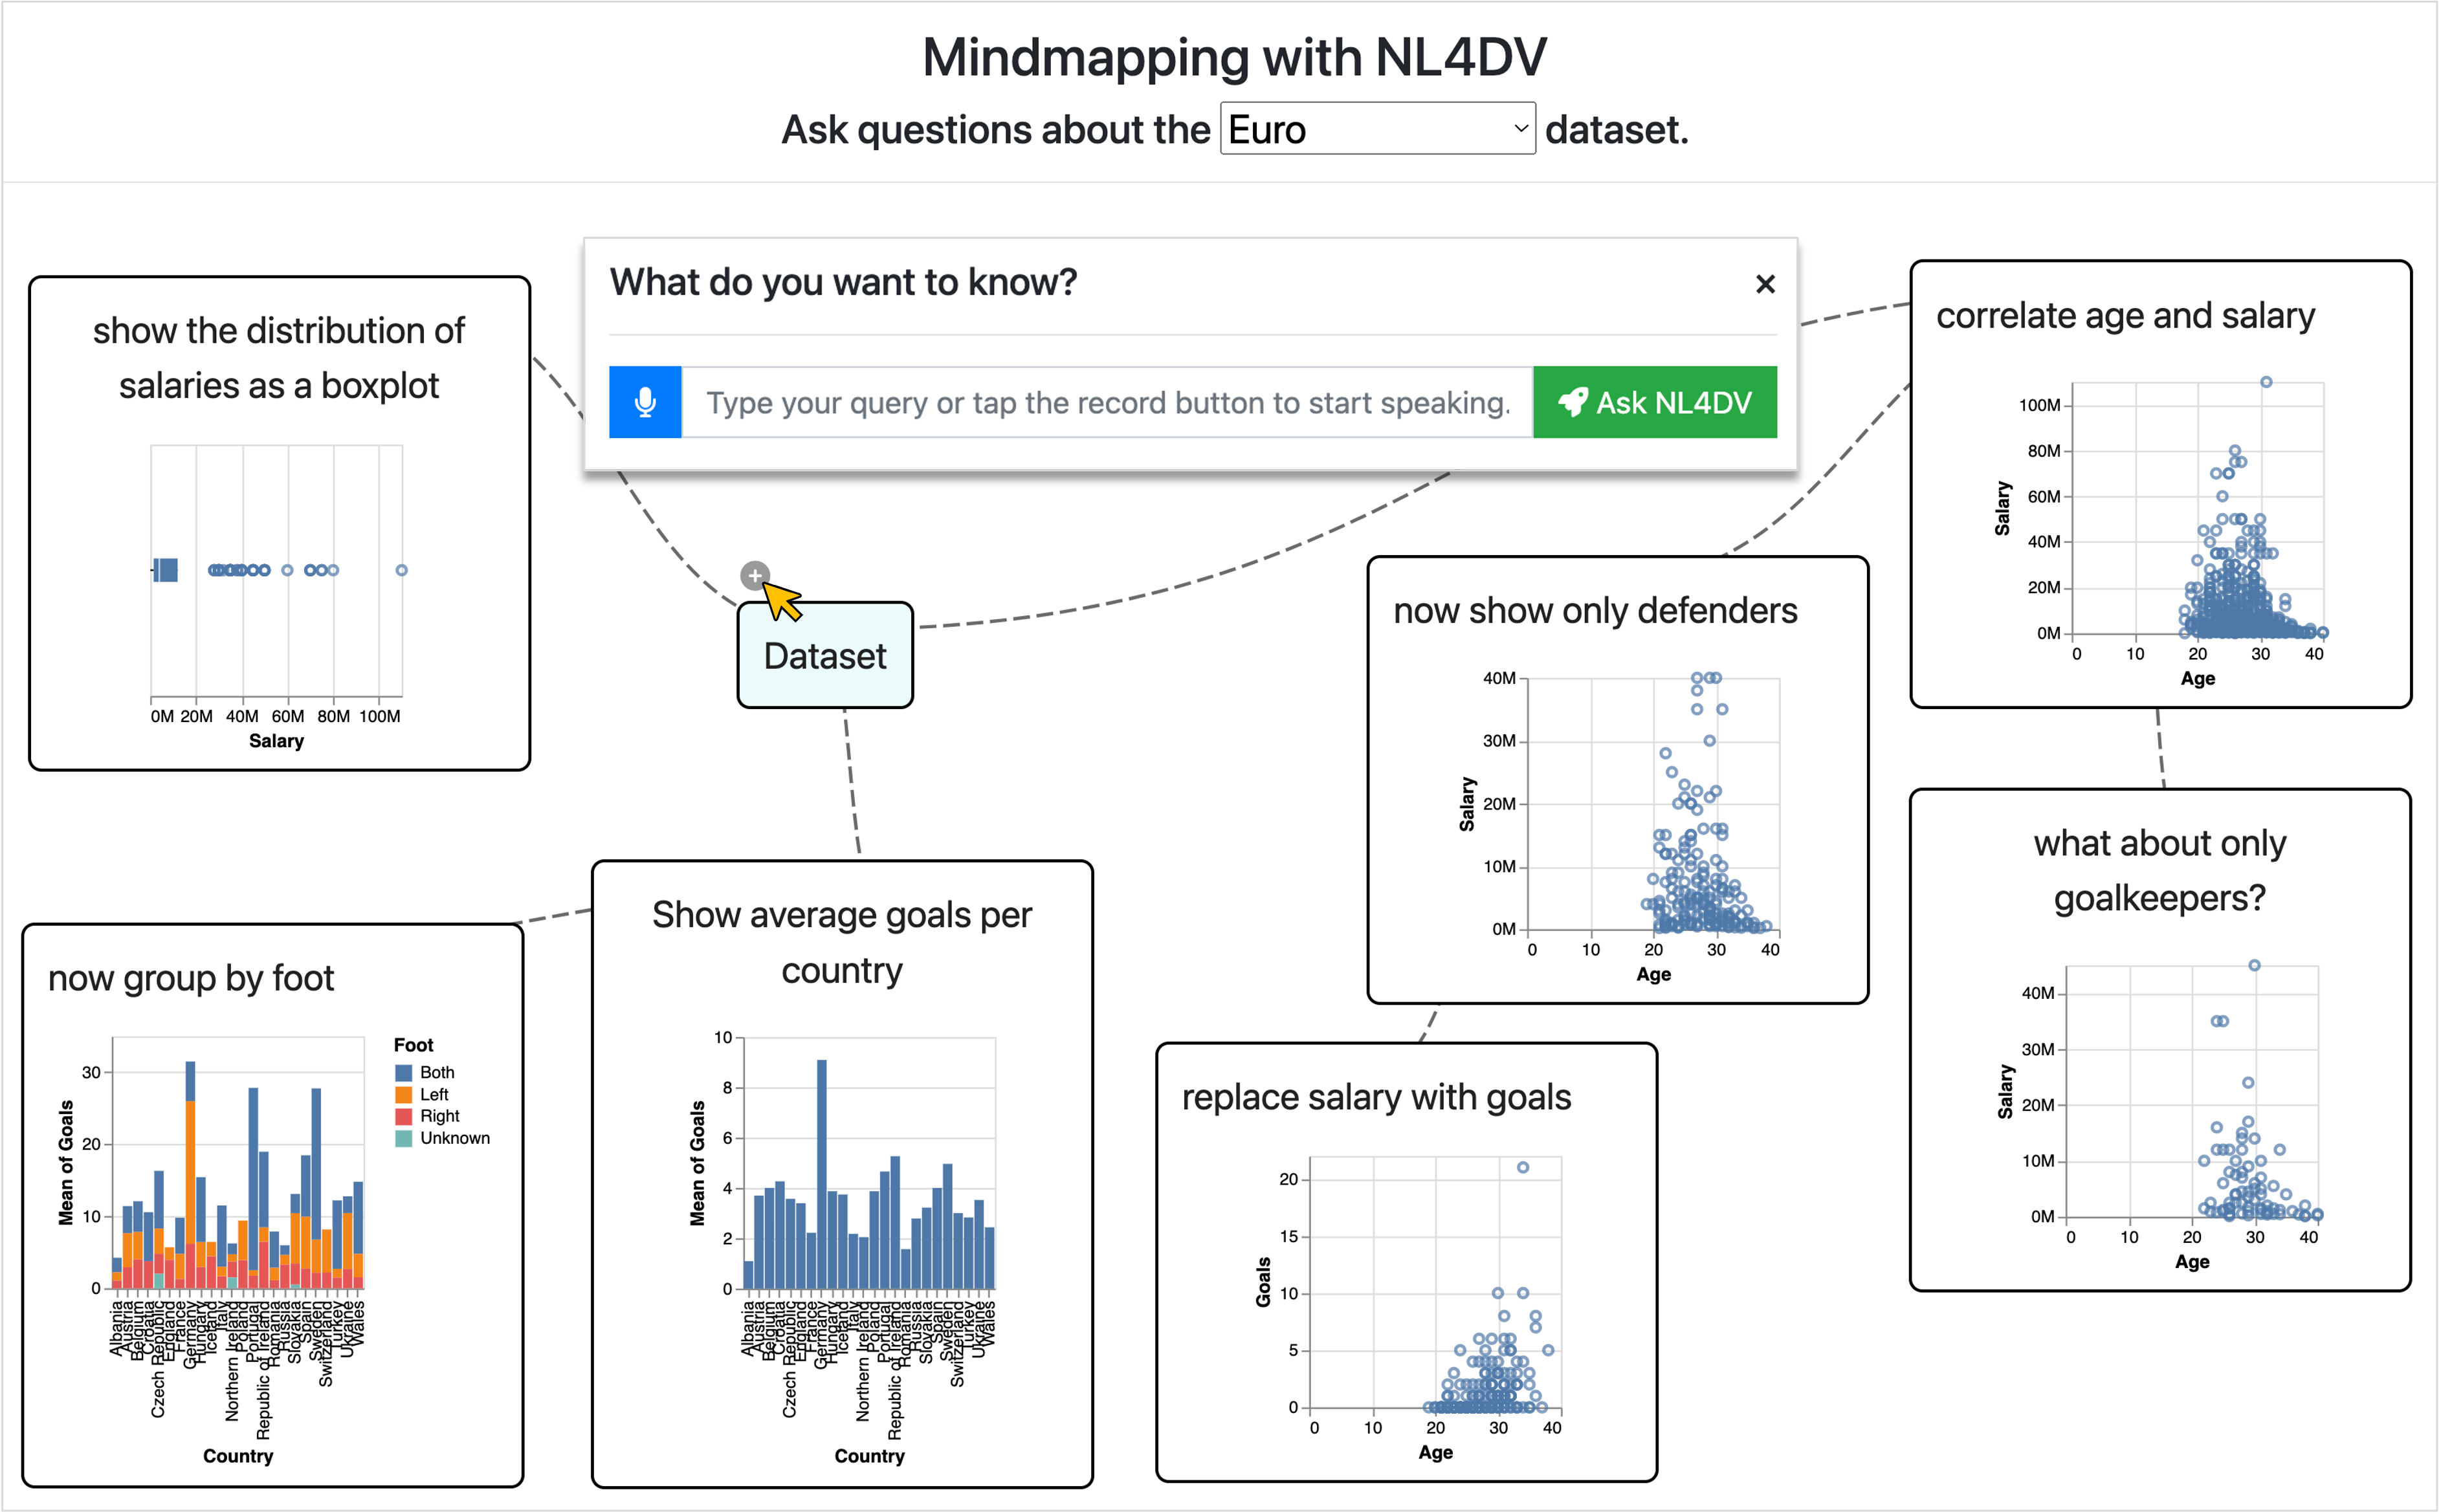
A mind mapping application that helps users engage in multiple simultaneous conversations regarding a dataset. Through speech or text modalities, users can ask standalone queries (e.g., "Show the distribution of salaries as a boxplot") as well as follow-up queries (e.g., "group by foot") through the plus icon, enabled by hovering on the corresponding mindmap node. Users can also follow-up on already followed-up queries, forming new conversational branches (e.g., "now show only defenders" and "what about only goalkeepers?"). Users can also delete a query (e.g., to paraphrase and recreate a new one), pruning the entire downstream conversation, including branches.
Chatbot | v2
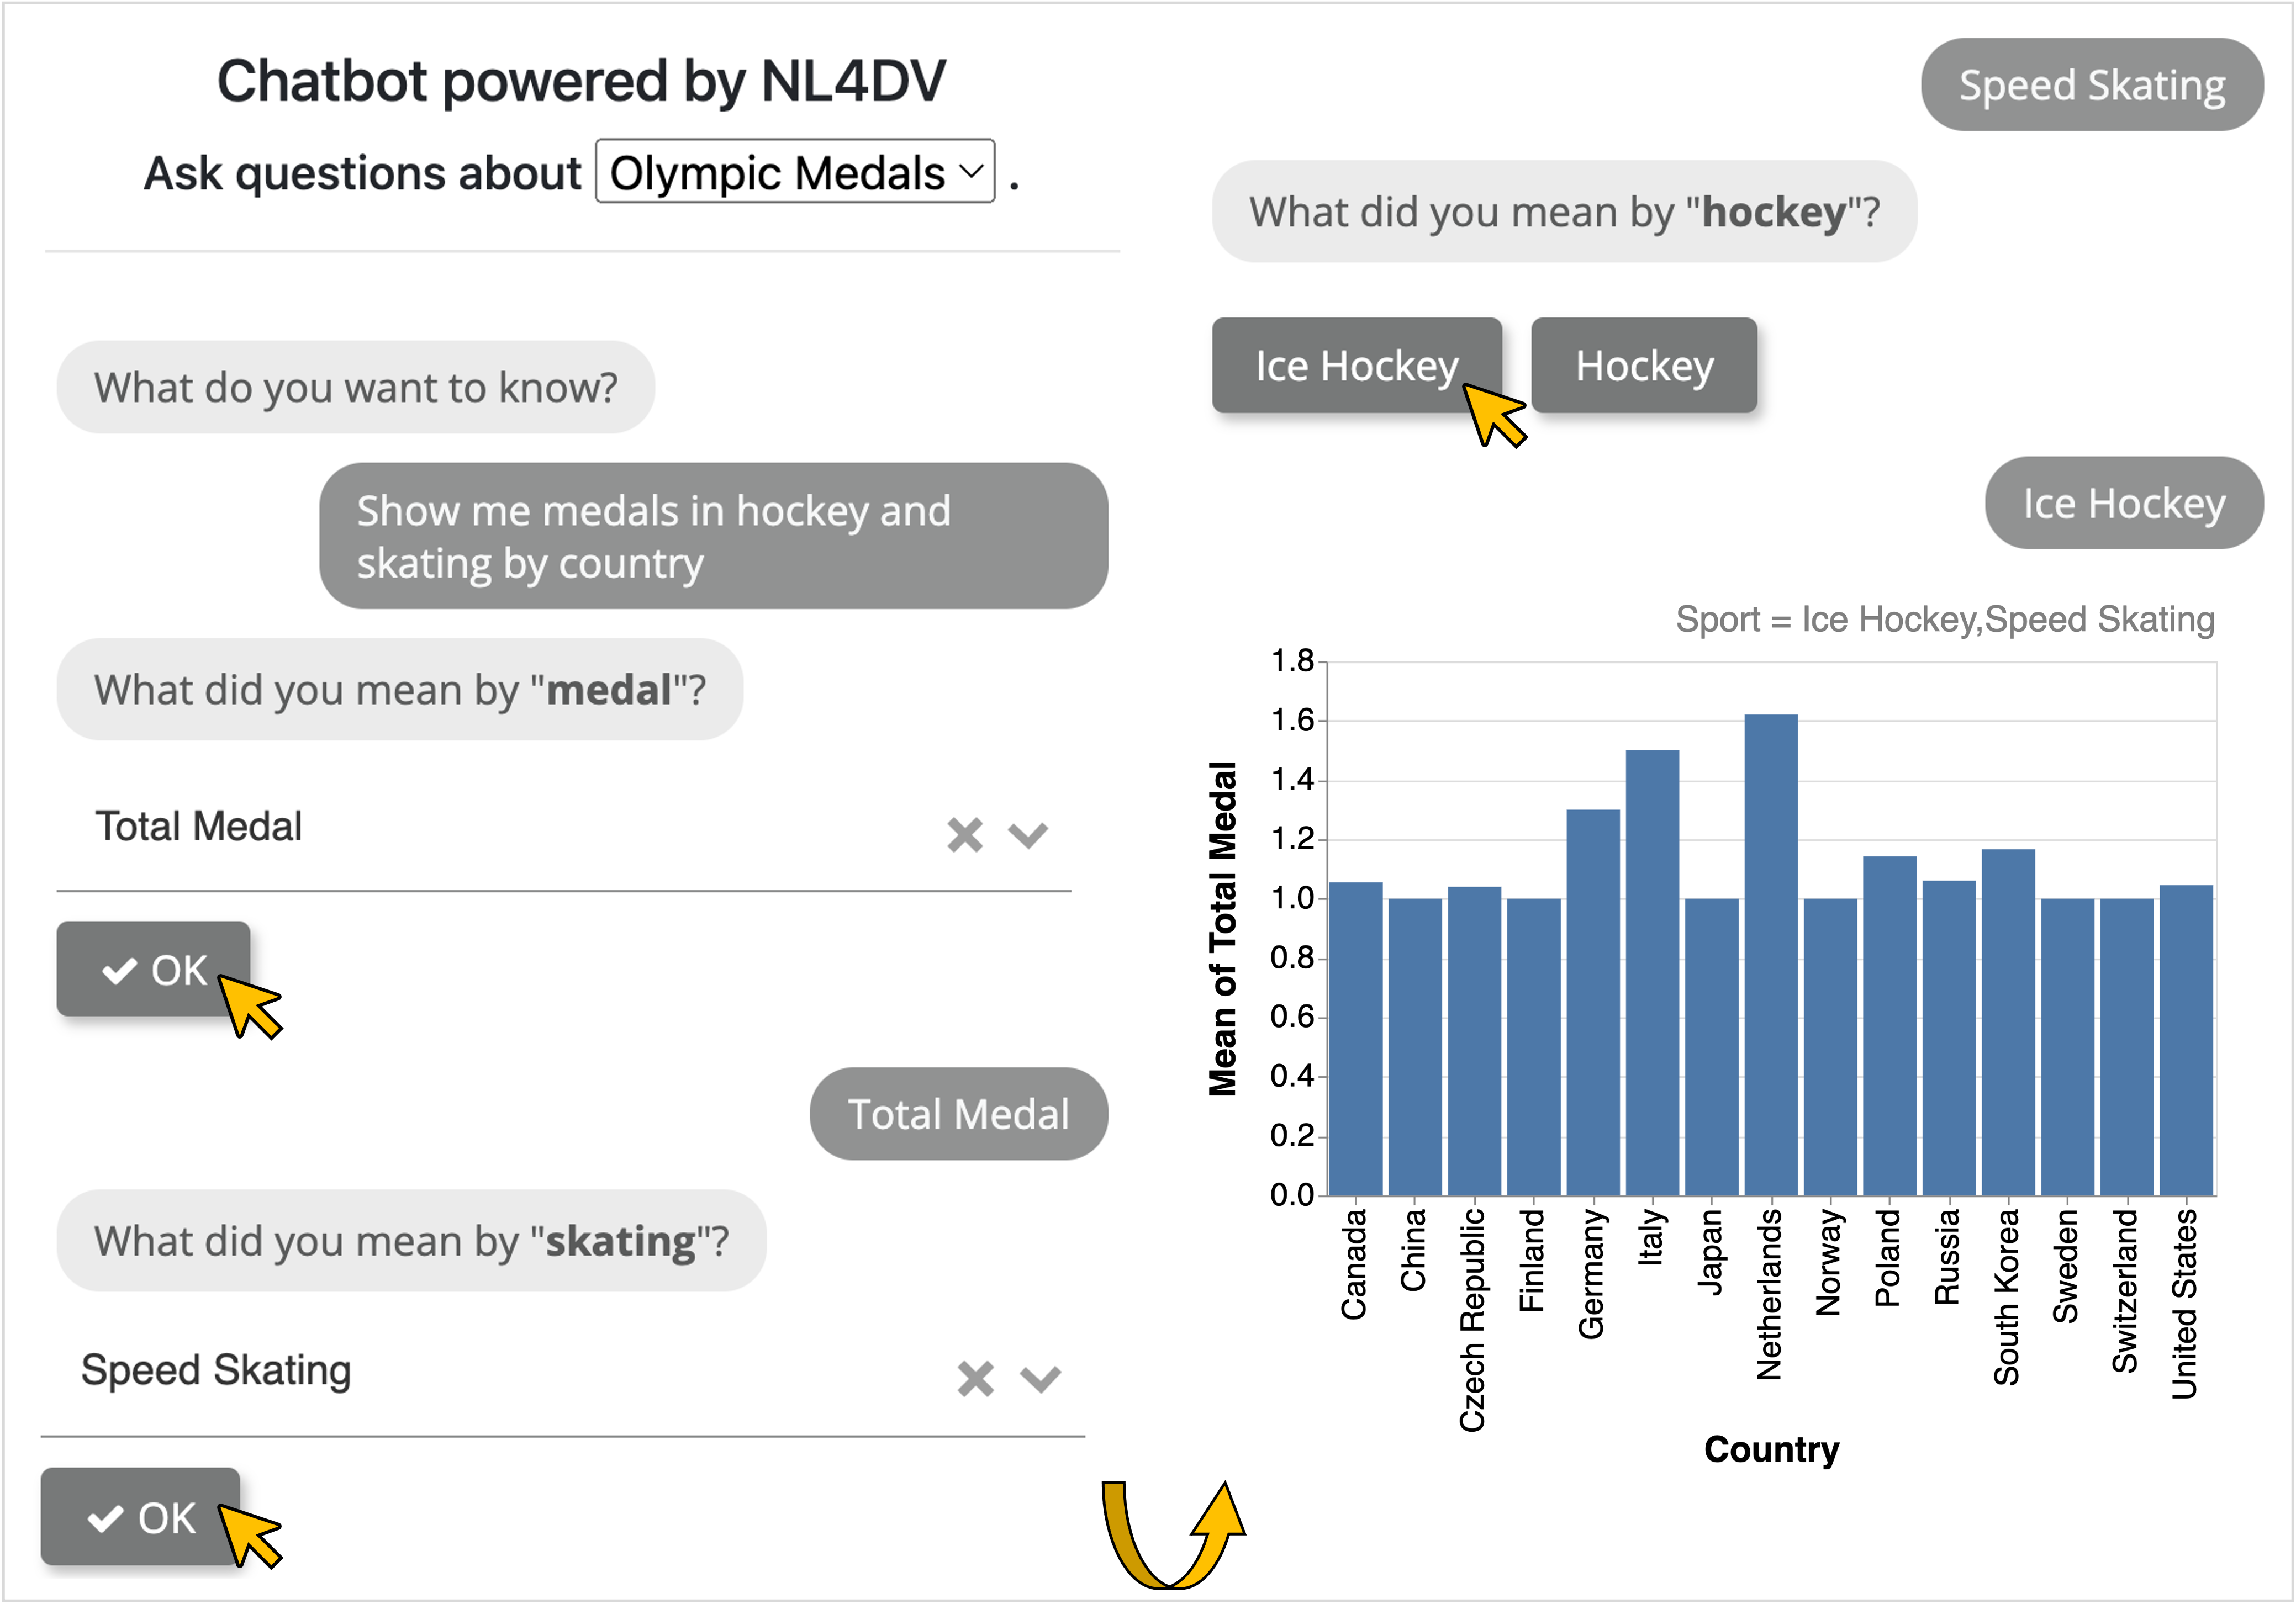
A conversational user interface that automatically detects user intent to follow up or not and helps resolve ambiguities through DataTone-like GUI-based "ambiguity widgets" (e.g., select dropdowns and buttons) through user interactions. Users disambiguate by responding to these prompts, notifying NL4DV through update_query(). Only after all ambiguities are resolved, the system renders the appropriate visualization.
Jupyter Notebook | v1
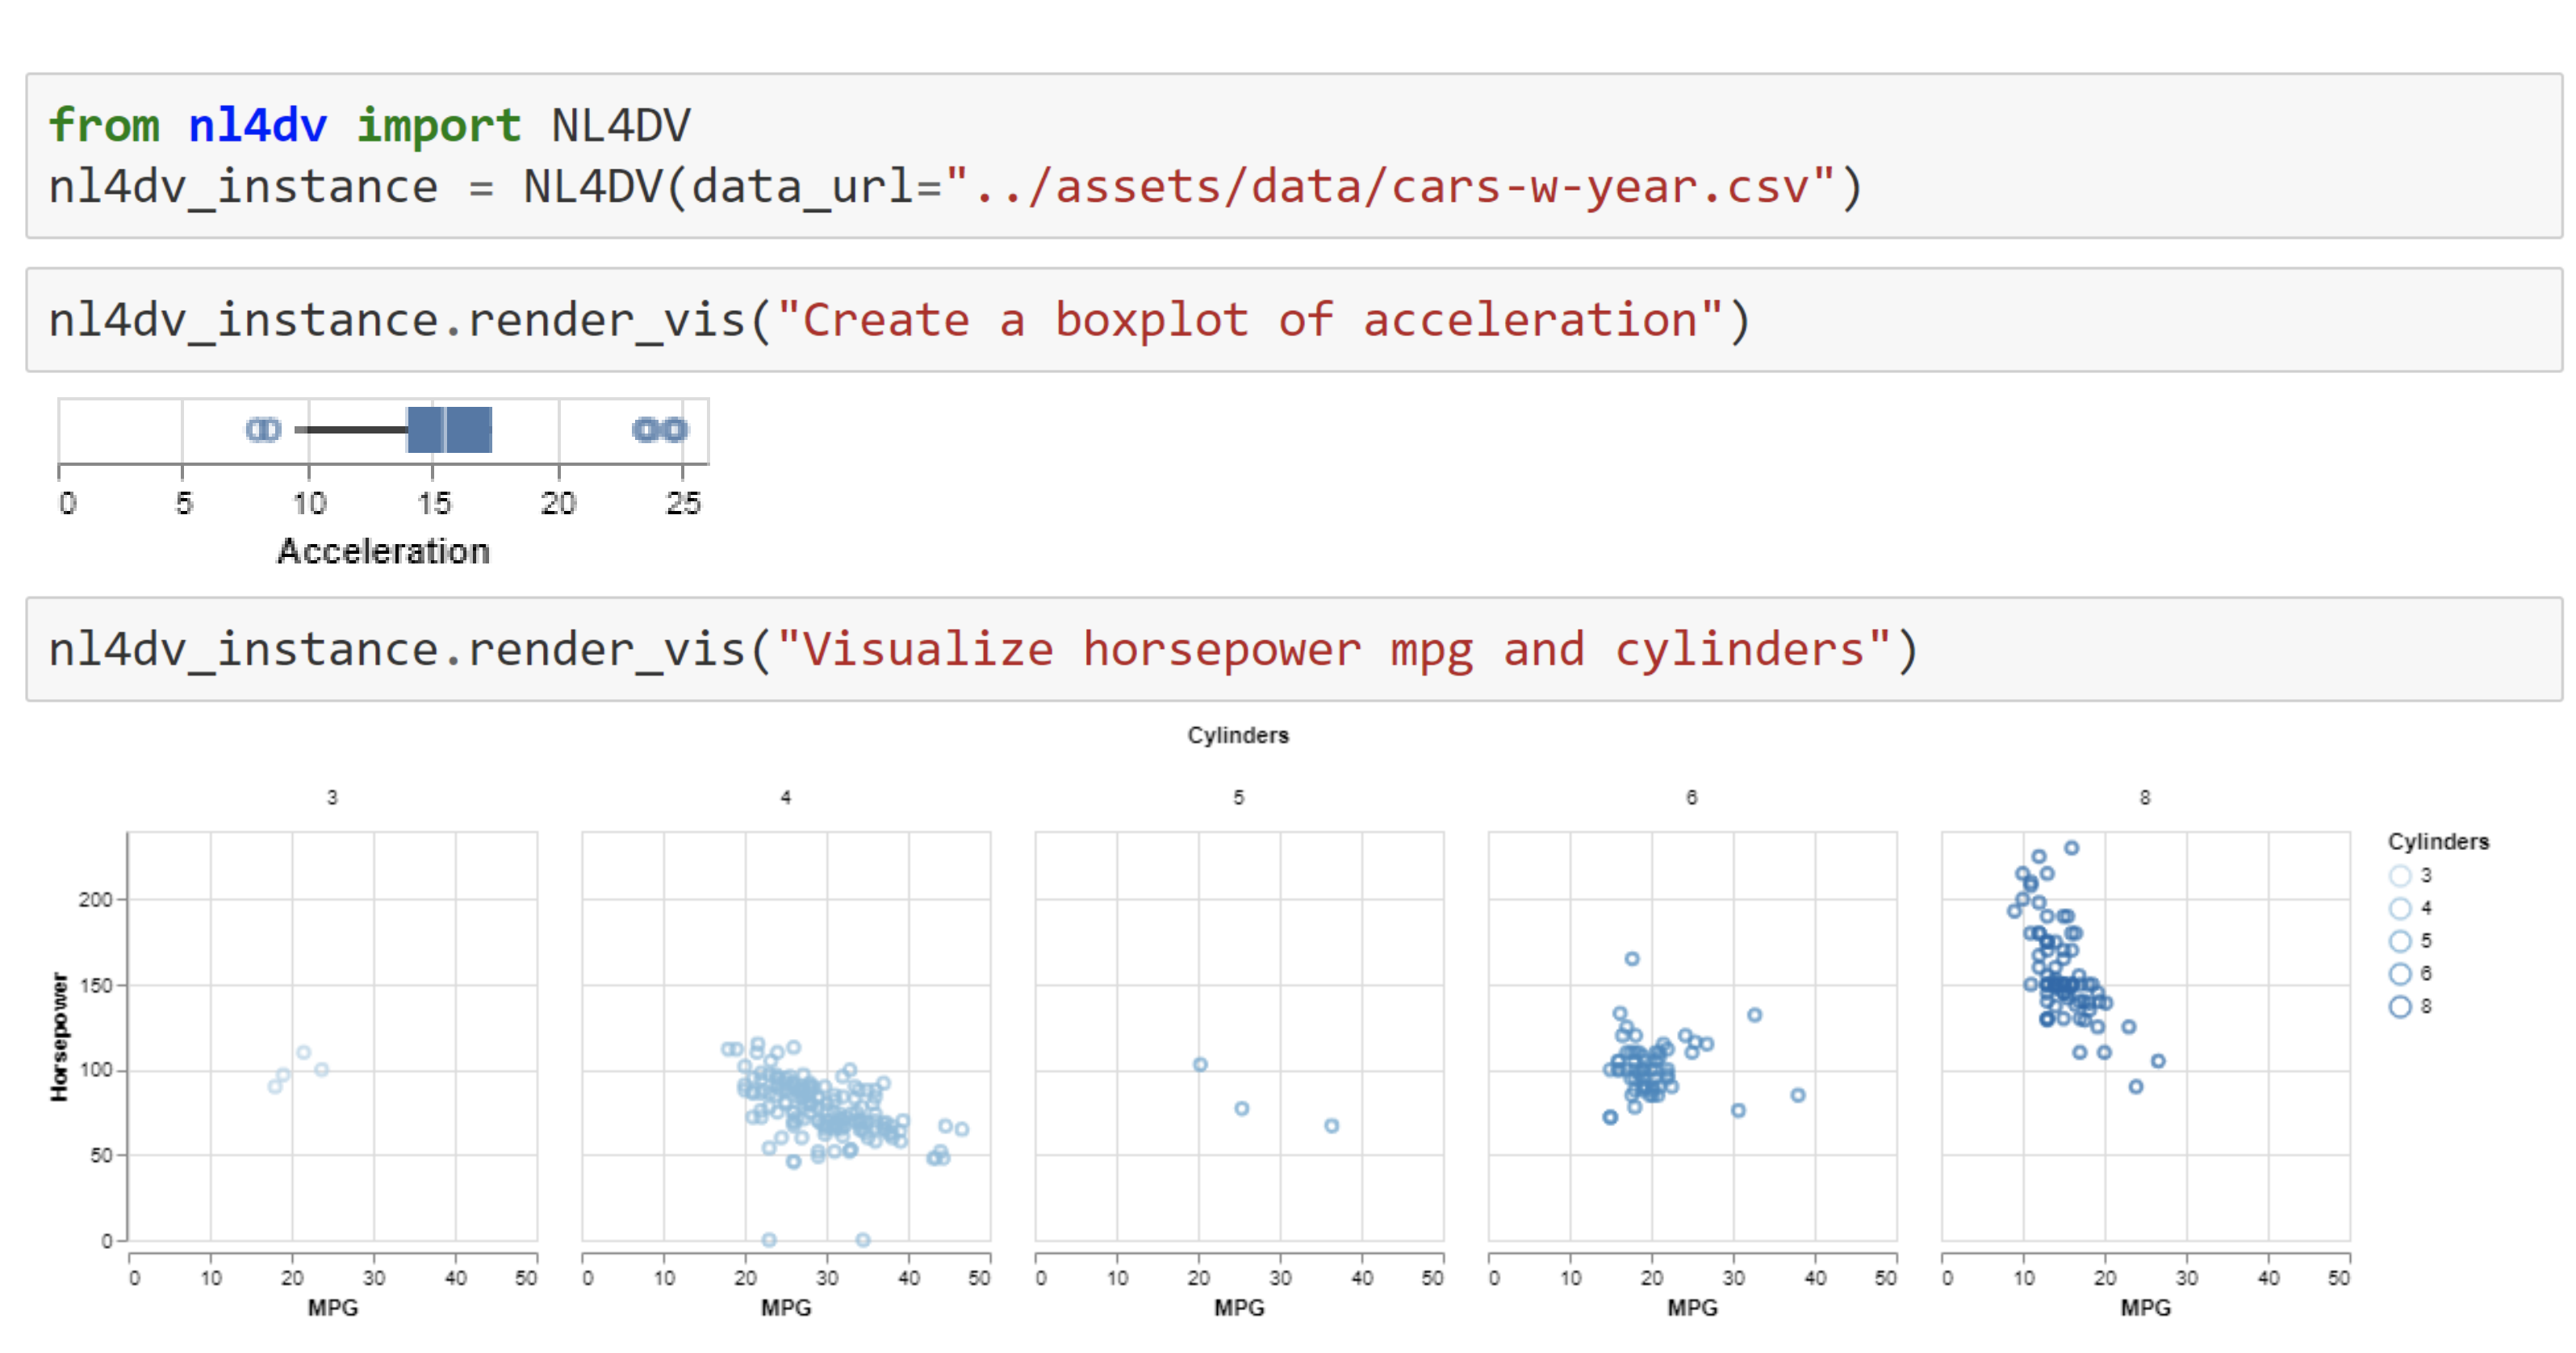
By rendering visualizations in response to NL queries in environments like Jupyter Notebook, NL4DV enables novice Python data scientists and programmers to conduct visual analysis without needing to learn about visualization design or Python visualization packages (e.g., Matplotlib, Plotly).
Vega-Lite Editor | v1
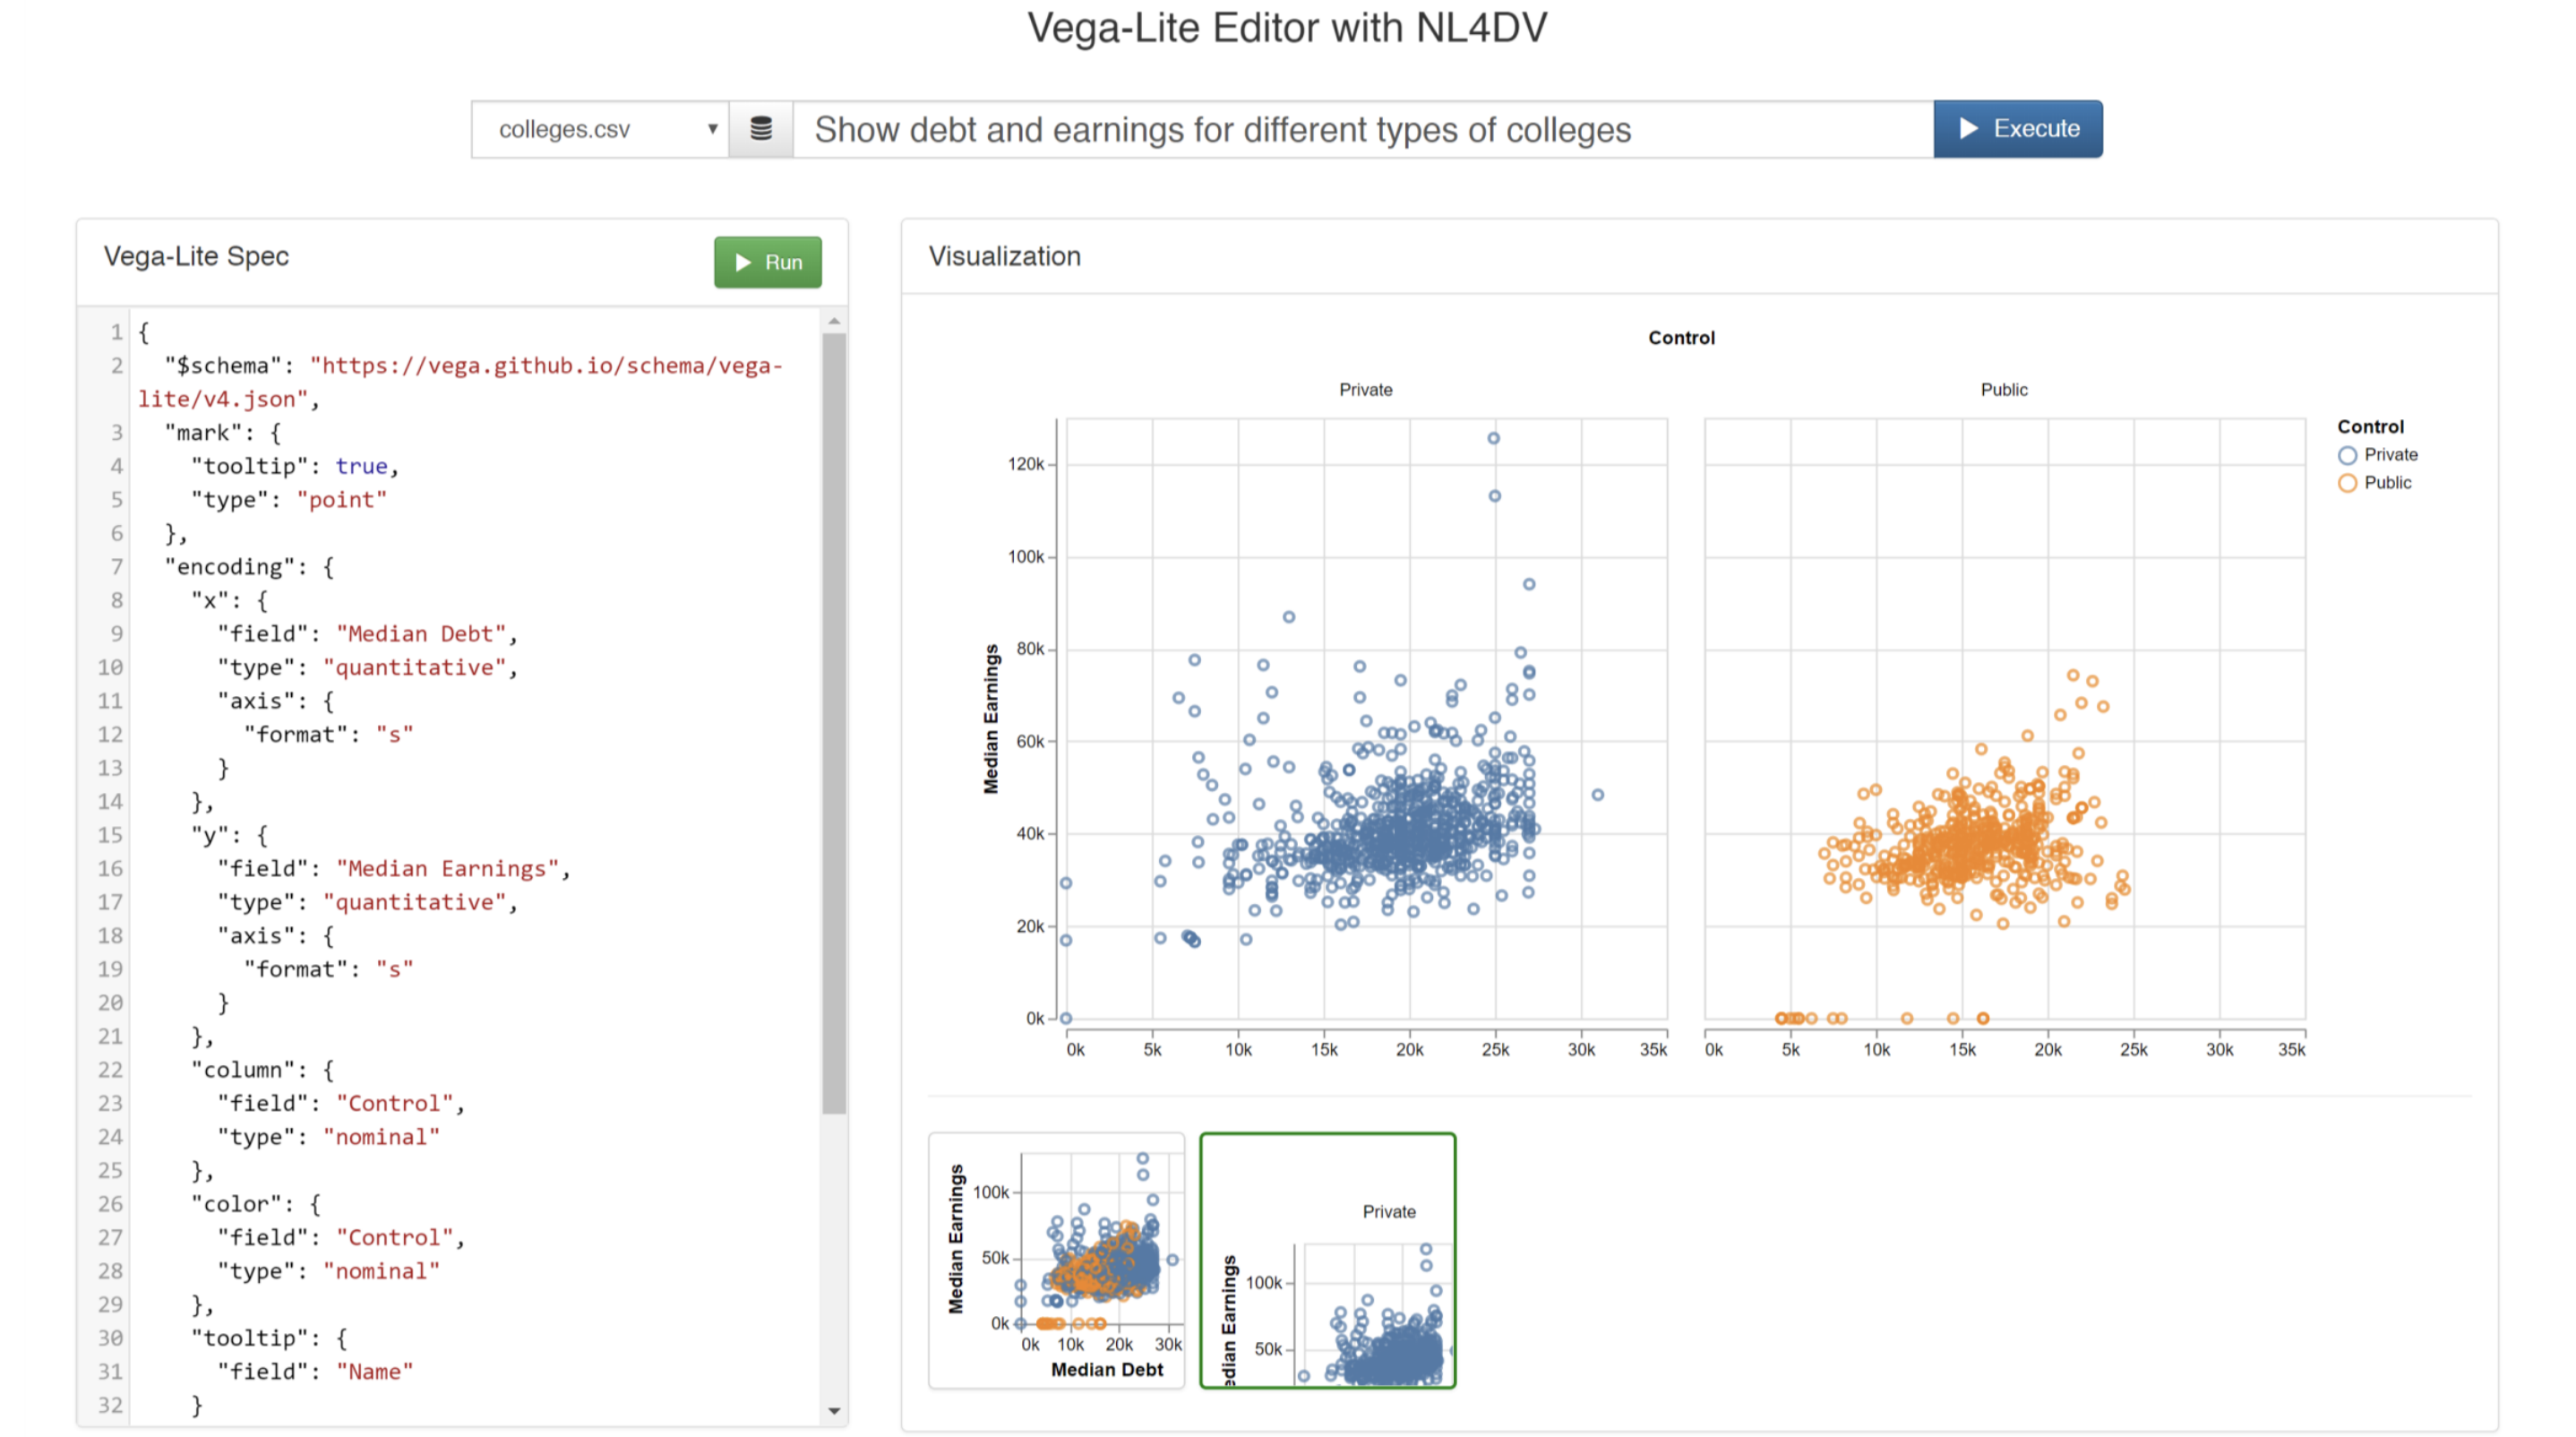
With this application, users can enter Vega-Lite specifications in the left panel and click "Run" to render the corresponding visualization. Alternatively, users who are unfamiliar with the Vega-Lite syntax can type in natural language queries into the input box at the top of the page and click "Execute" to generate a Vega-Lite specification corresponding to the input query. Additionally, the system also suggests alternative visualizations that may be relevant to the entered query as thumbnails at the bottom of the page. Clicking these thumbnails displays the chart and its corresponding specification on the left. Note that if a specification is manually edited, the recommended visualizations at the bottom of the screen get removed but the previous query remains in the input box for easier reference.
DataTone | v1
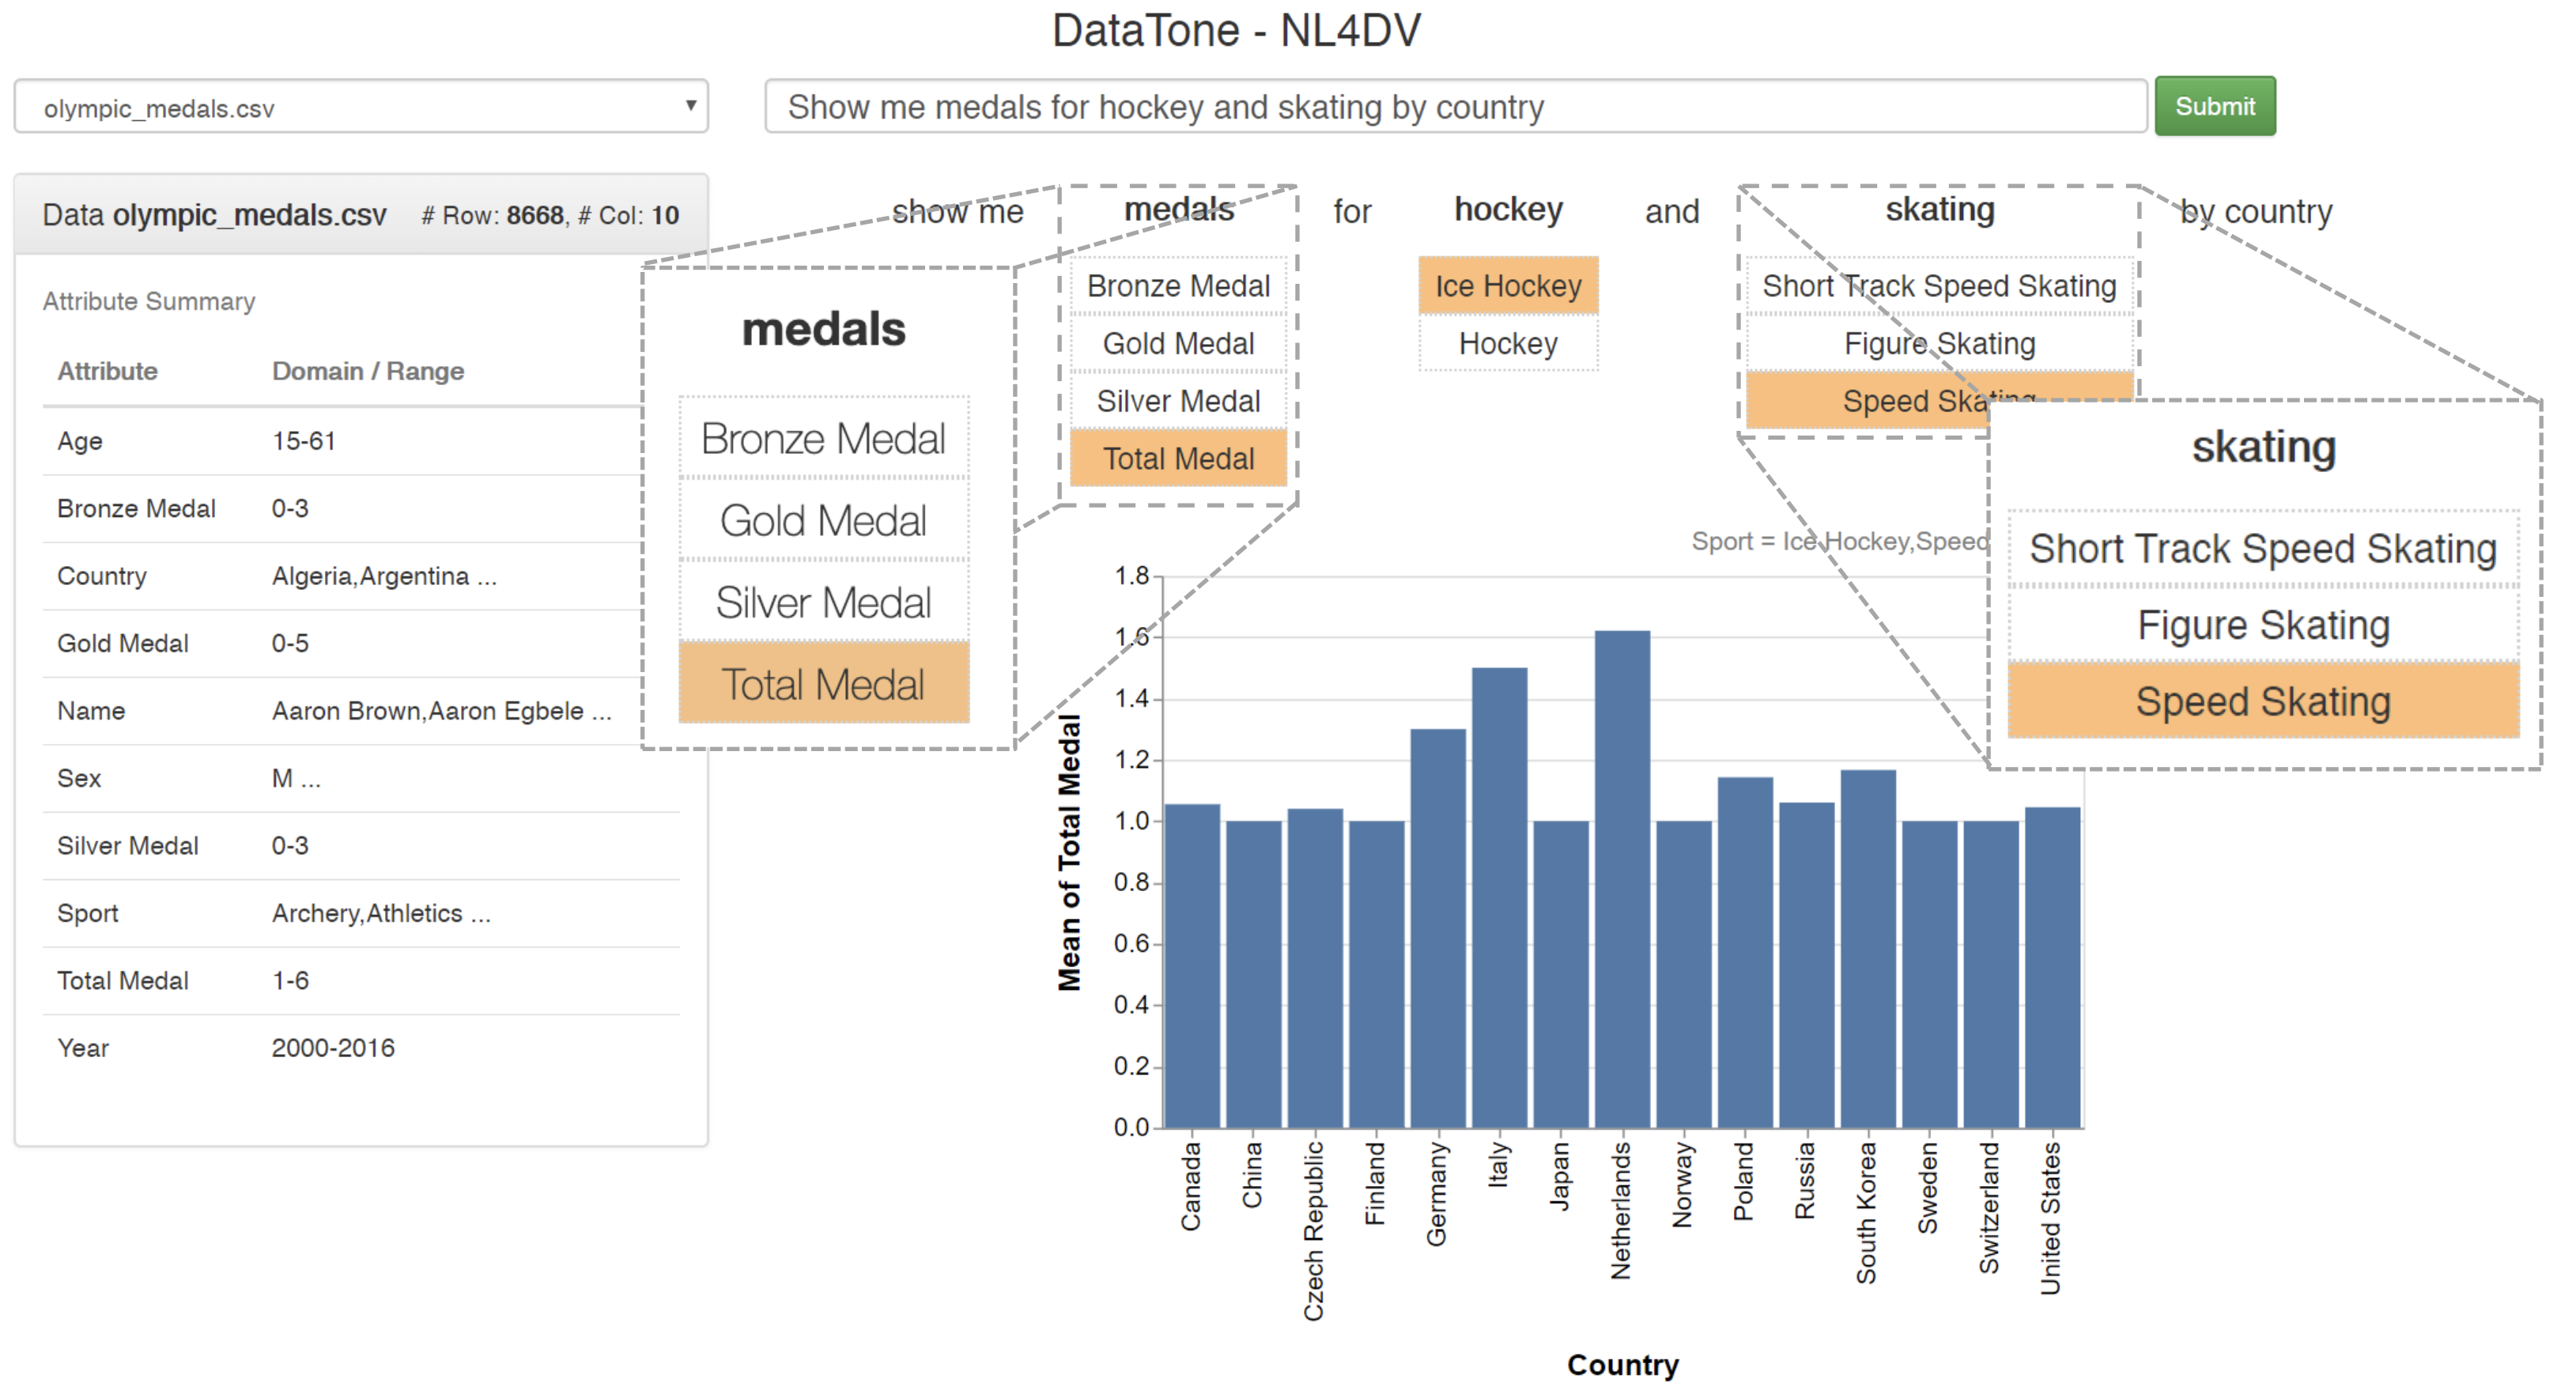
This application is inspired by DataTone (Gao et al, UIST'15). Once a natural language query is entered via the input box at the top of the screen, in addition to a visualization, the system highlights ambiguities in the input query through options in a dropdown menu. Clicking through these options helps the system "resolve" ambiguities and present more relevant visualizations. Note that this example does not replicate all of DataTone's features and focuses on highlighting data attribute- and value-level ambiguities.
MMPlot | v1
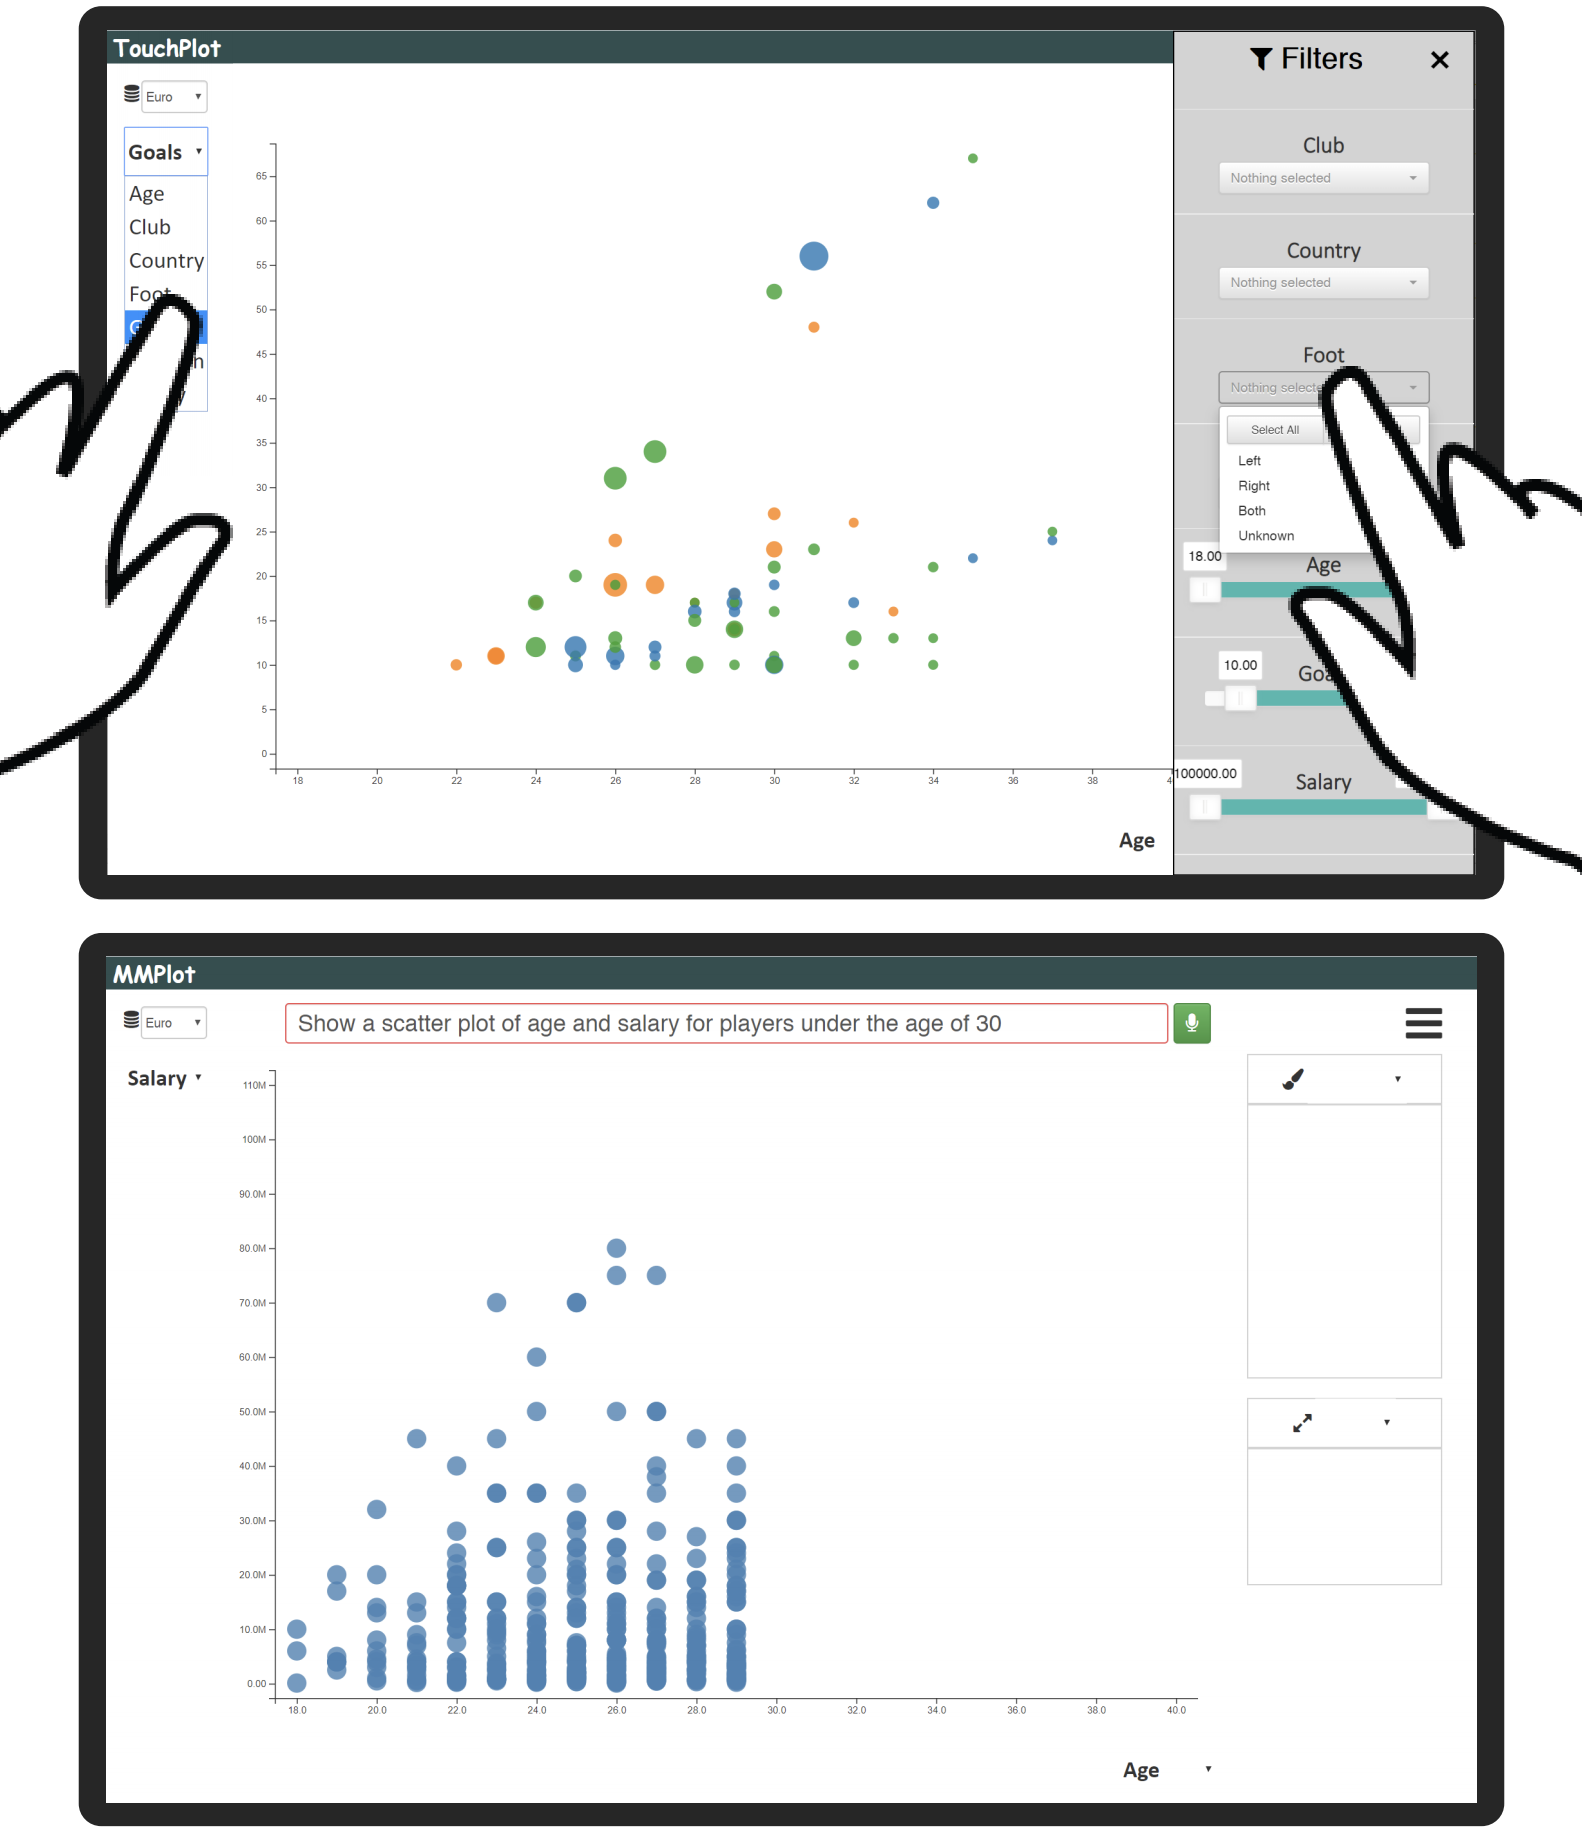
MMPlot is a multimodal scatterplot visualization system that allows creating and interacting with scatterplots using direct manipulation (through mouse or touch) and voice. Supported direct manipulation interactions include changing x, y, color, and size attributes using axis and legend dropdown menus, filtering using the control panel on the right (collapsed by default), zoom/pan, and tapping on individual points to see their details. Instead of performing repeated actions with mouse or touch, users can leverage voice to specify charts, apply filter, or do both through a single query.
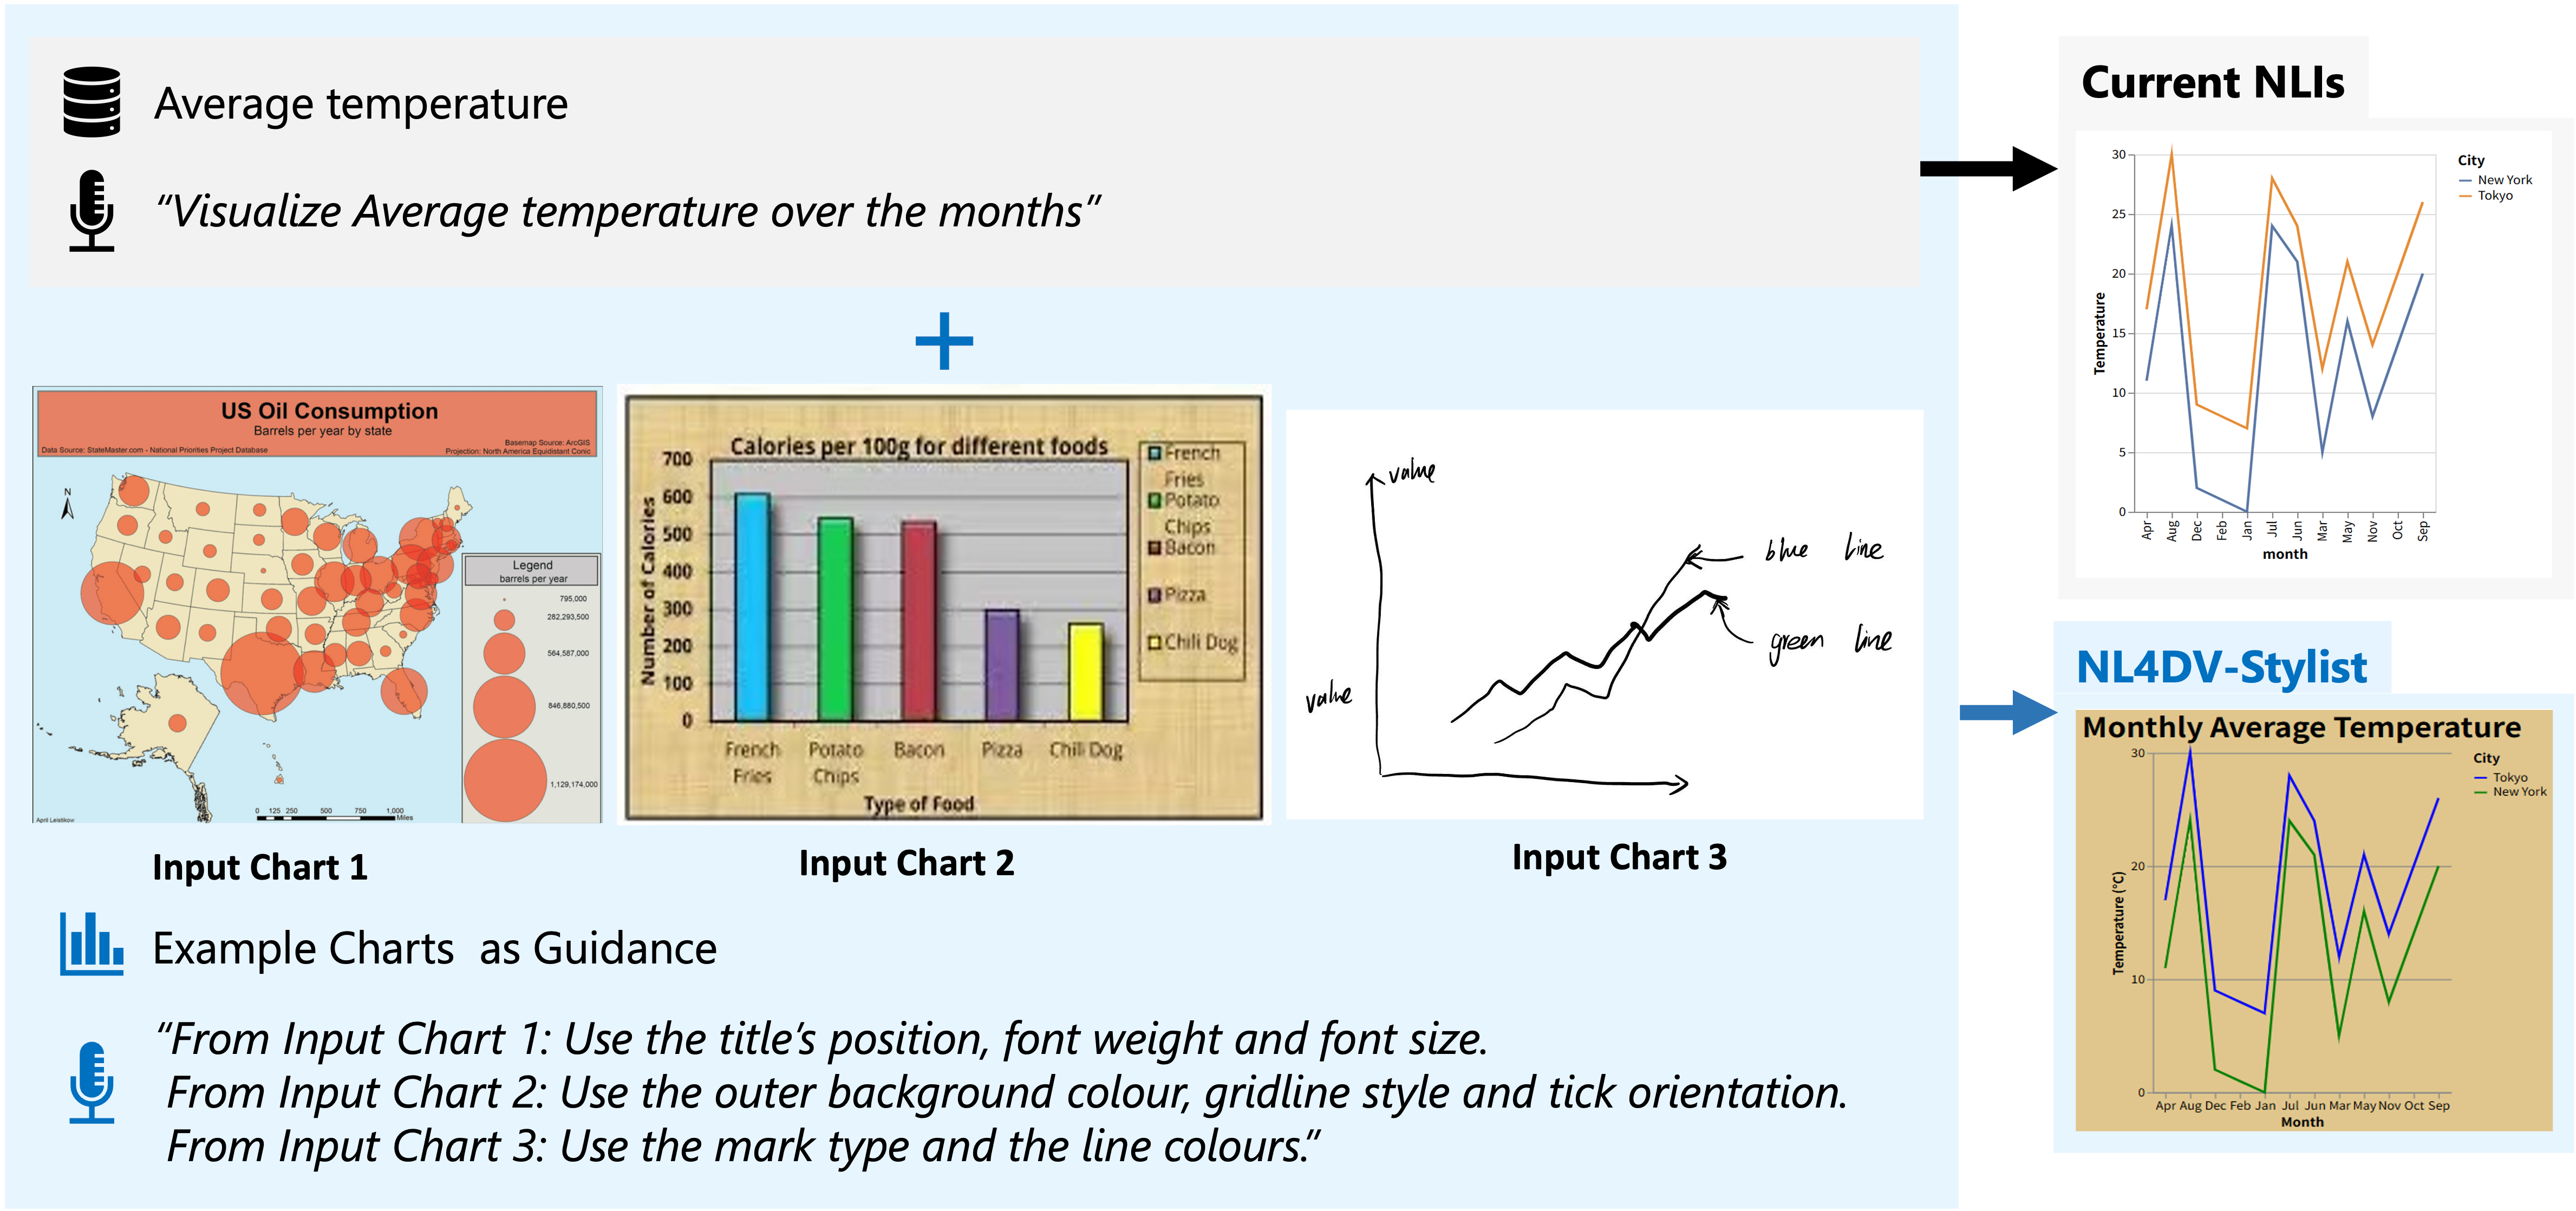
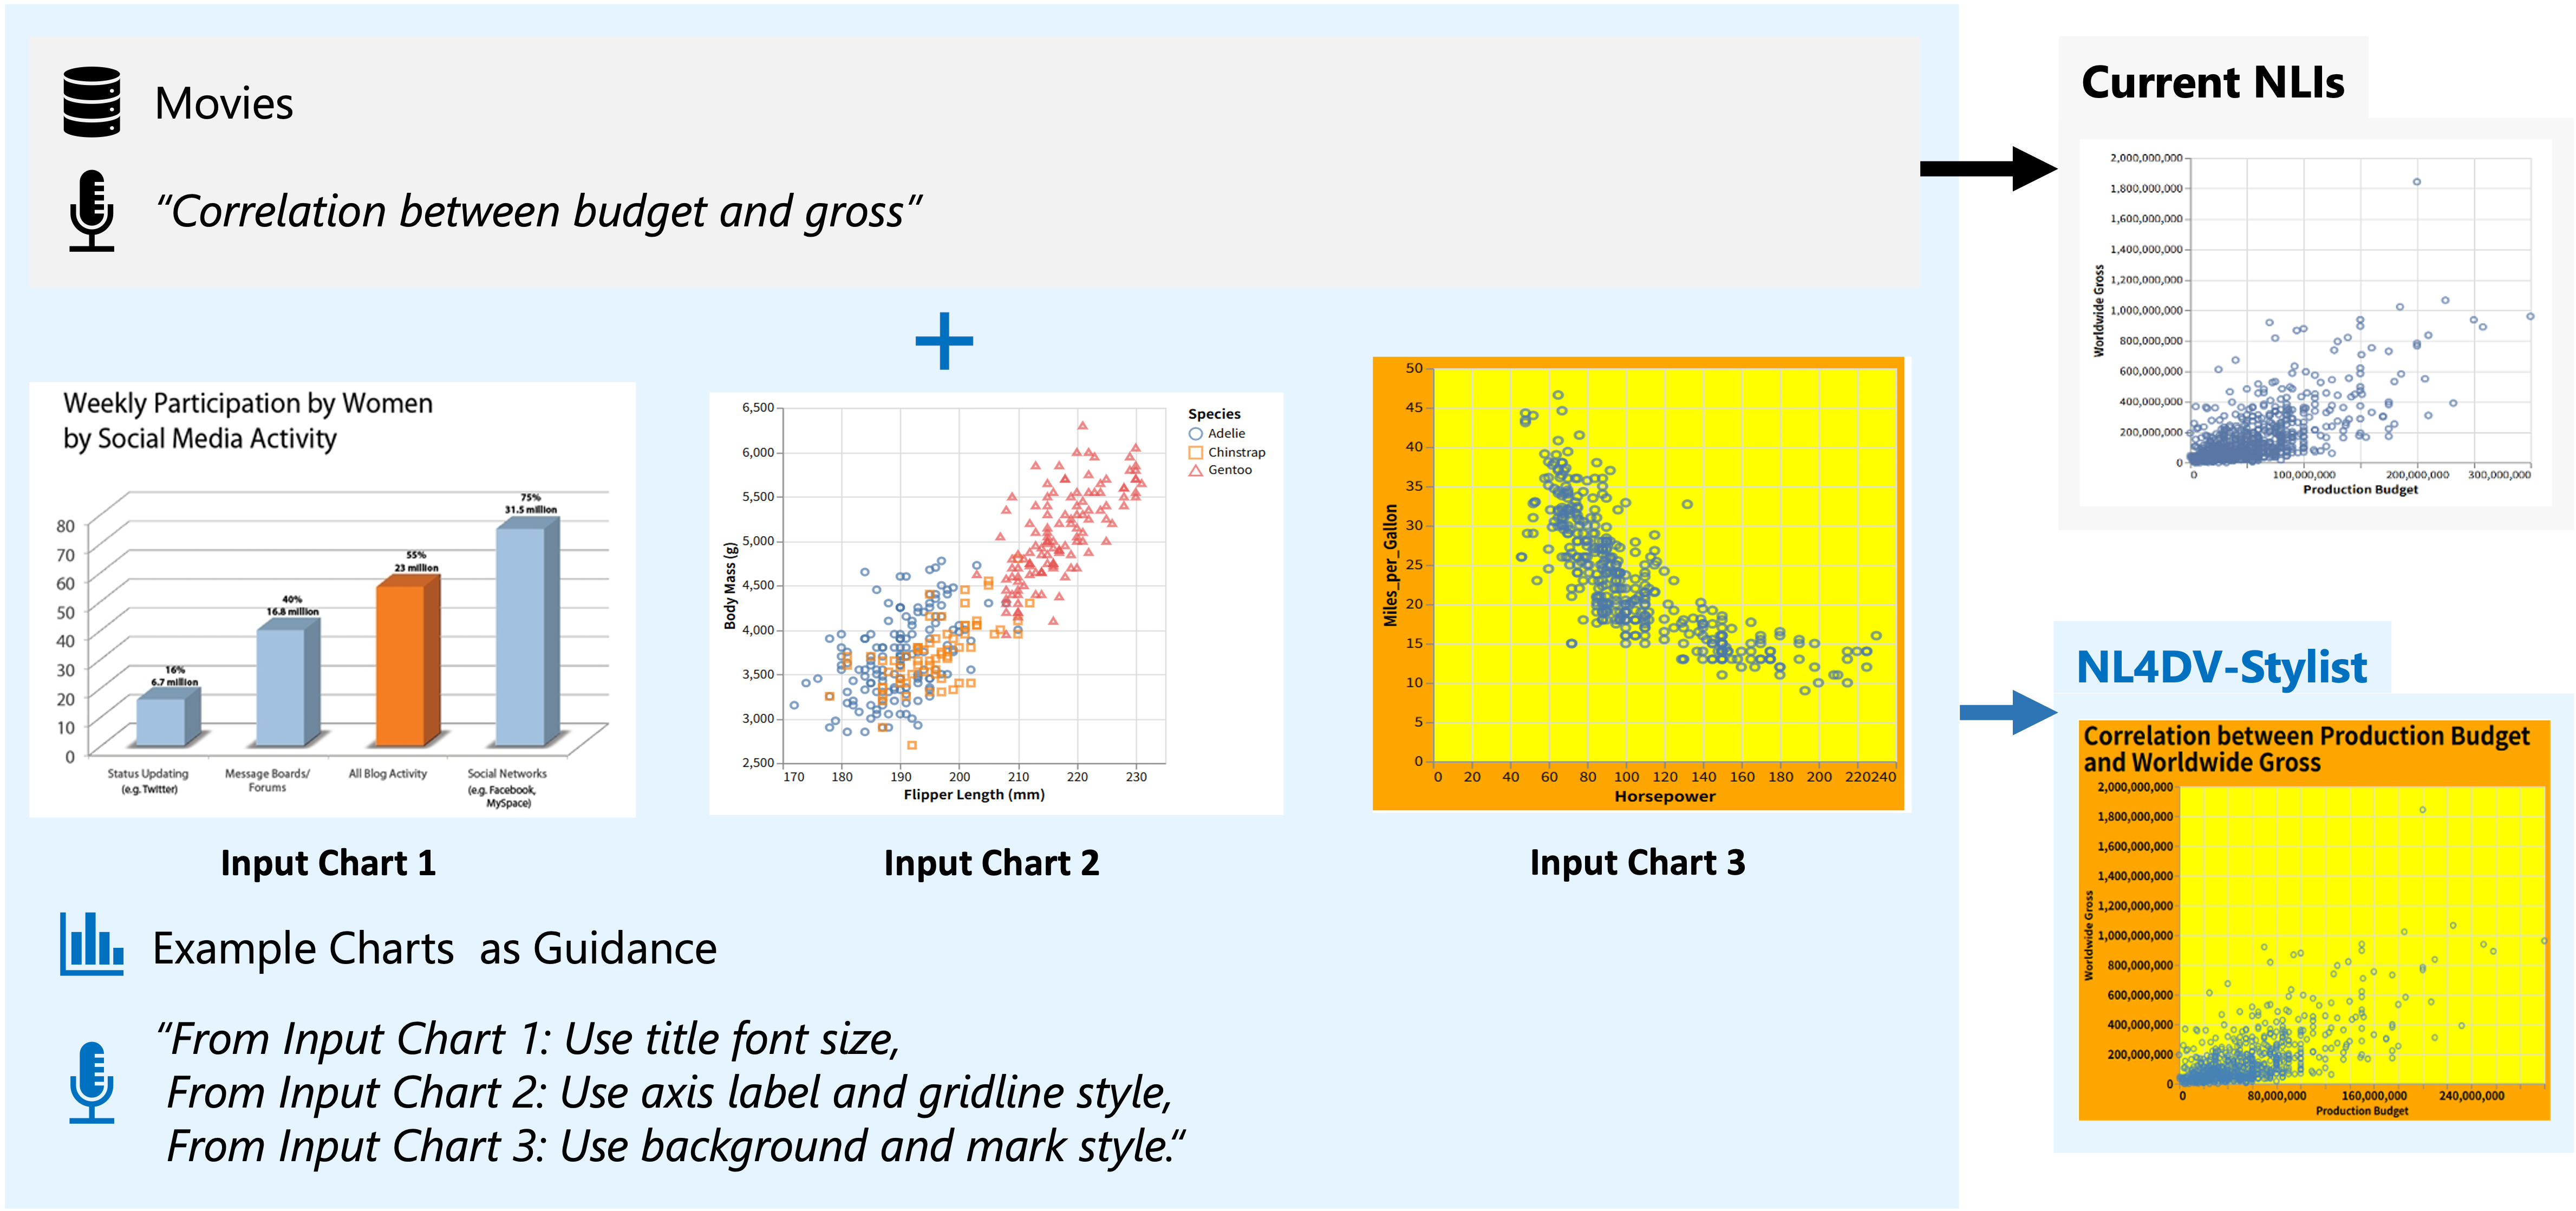
Sample Queries | v4 ('language-model') | NL4DV-Stylist
Example 1 | Basic

Example 2 | Advanced
Example 3 | Advanced
Sample Queries | v3 ('gpt') | NL4DV-LLM
Fully-Specified
Queries containing explicit references to attributes, tasks, and visualizations.
Dataset: Movies
Click on a query to show/hide recommended visualizations or click or
Under-Specified
Queries without explicit references to attributes, tasks, or visualizations.
More Queries
These queries are not split by the level of detail they provide and contain a mix of under-specified and fully-specified queries.
Multi-Turn Dialogs | as part of v3
These queries are not split by the level of detail they provide and contain a mix of under-specified and fully-specified queries.
Sample Queries | v2 ('semantic-parsing') | Multi-Turn Dialogs
These queries are not split by the level of detail they provide and contain a mix of under-specified and fully-specified queries.
Sample Queries | v1 ('semantic-parsing) | One-off Utterances
Fully-Specified
Queries containing explicit references to attributes, tasks, and visualizations.
Dataset: Movies
Click on a query to show/hide recommended visualizations or click or
Under-Specified
Queries without explicit references to attributes, tasks, or visualizations.
More Queries
These queries are not split by the level of detail they provide and contain a mix of under-specified and fully-specified queries.